How to keep your product alive: poor man's SRE
Table of Contents
Let's imagine your product didn't die and managed to gain some real traction (🎉 CONGRATULATIONS!). After a few years it stops being a small and nimble project and turns into something much bigger, involving dozens and hundreds of people.
Project lifecycle: MVP -> growth -> maintenance
What does a full-stack engineer of a new project think about? Exciting questions: what programming language to choose, Bootstrap vs Tailwind, React vs vue.js, services or microservices, and so on. "How to build the product"? Those days are certainly wonderful, but there comes a time when rapidly deploying features using the latest framework is no longer as important and cool as maintaining the reliability and stability of the entire system - year after year, preferably without any major f**k-ups.
Now that Qwintry can no longer call itself a startup, the focus shifts from introducing new features to SRE (Site Reliability Engineering) - ensuring the availability, reliability and performance of the product. Some might say it's grim and boring, but in my opinion, the ability to sit down and meticulously investigate, analyse, unravel the threads of logs and reconstruct events in production is what makes a person a valuable employee and a true engineer (and detective). And you can get a kick out of it too.
Poor man's approach to SRE of a small business
We don't have a dedicated SRE team - we're no longer a startup, but we're still a long way from being a rich corporation. So our approach is very different from what bigger companies do. When things go south, we plug the holes as best we can: our development people, our testing people, our devops people and myself - we all get involved in some way. In this situation, the stack of products we use to monitor, analyse and manage our services comes to the fore. Why is that? If you have to run to the server and grep through logs from the console every time you want to analyse a problem - no one wants to do that, it's inconvenient, and it also severely limits the number of people who can do that analysis.
Our stack of boring and predictable SRE tools
Zabbix
For cloud and physical server monitoring and Telegram alerts, we've been using Zabbix for a very long time, which allows us to track the health of servers, networks and services. It's not very ergonomic in terms of adding new hosts and creating alerts, to be honest, a lot of clicks and taps - but it gets the job done. Zabbix was launched in 2001 (sic) and is still actively developed and improved - a perfect example of a great open source product.
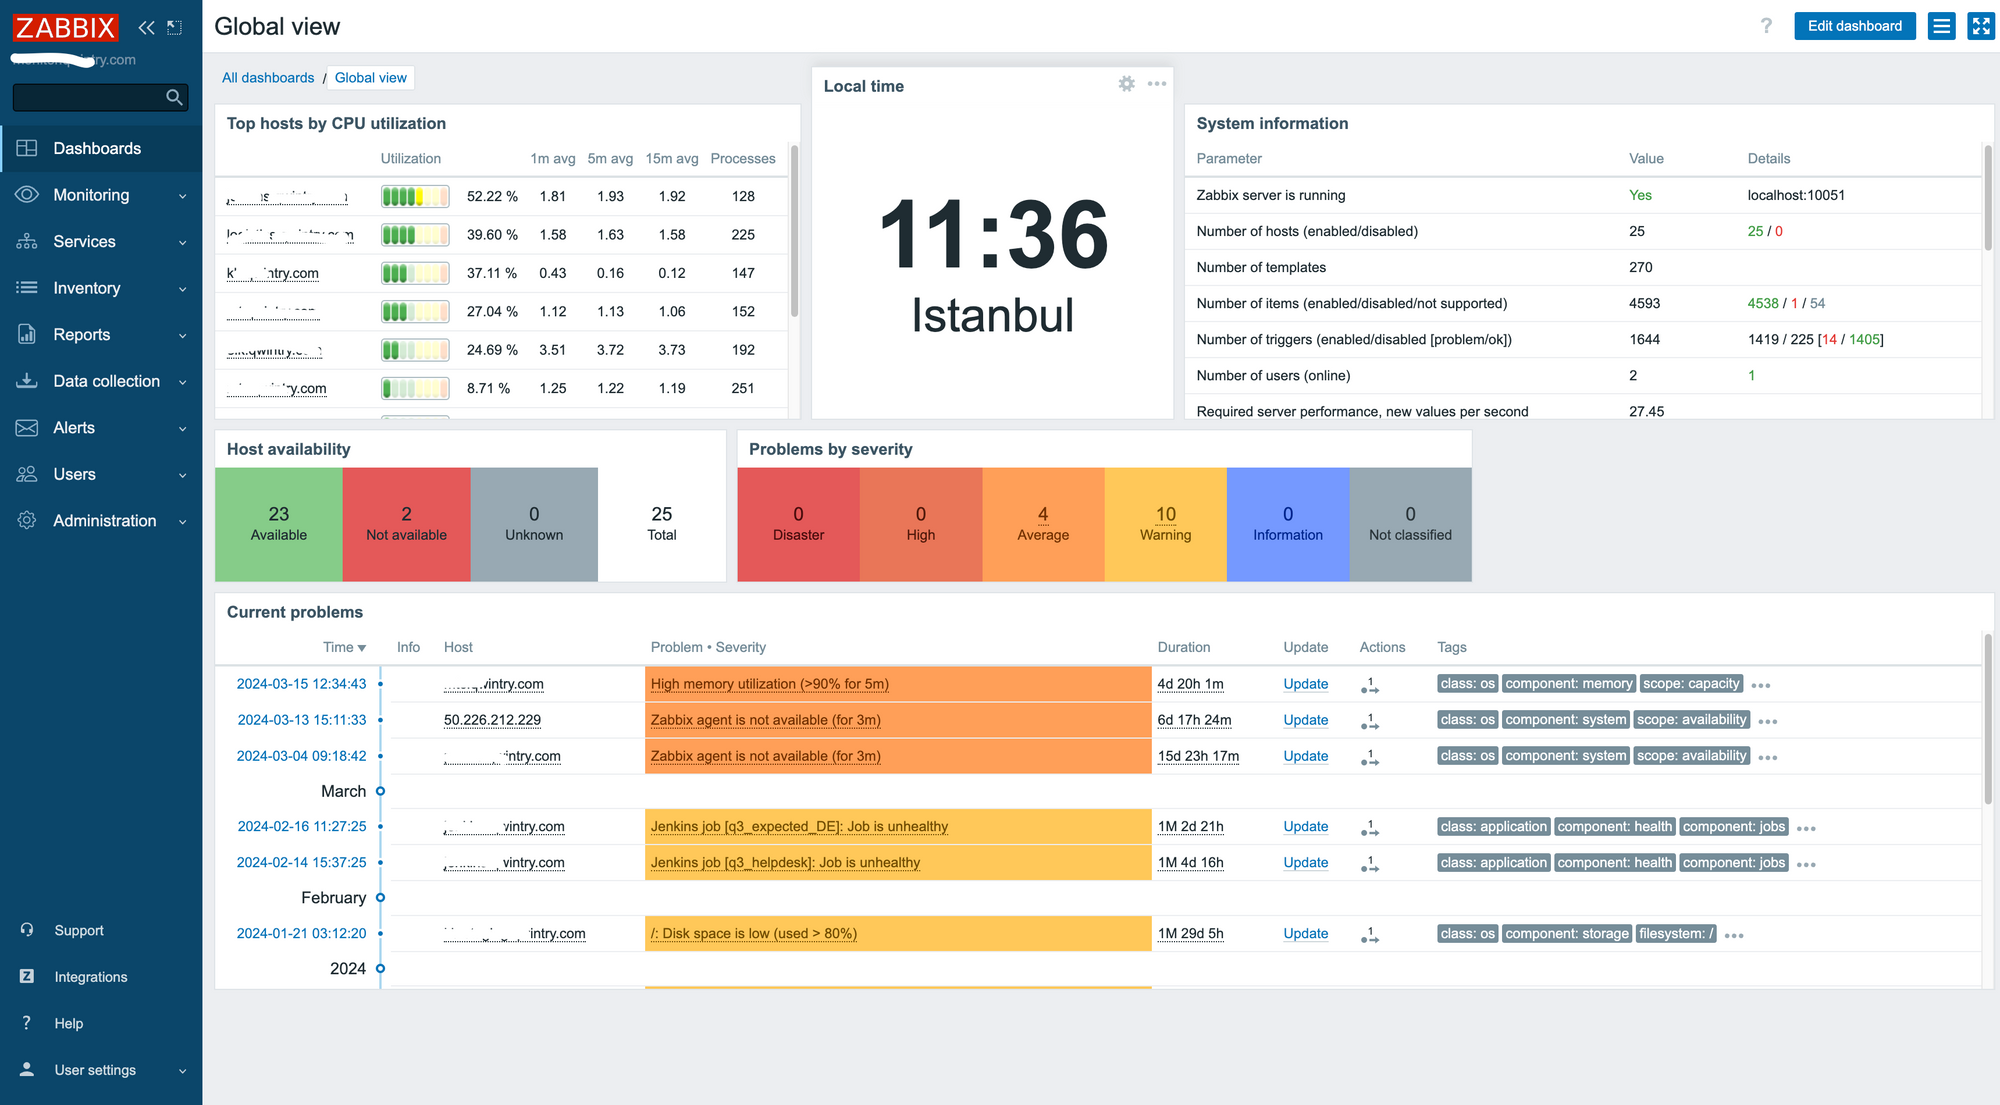
I think Prometheus + Grafana now allow to build a very similar dashboard – but Zabbix just works for us and we never had a lot of reasons to switch.
ELK Stack for log storage and analysis
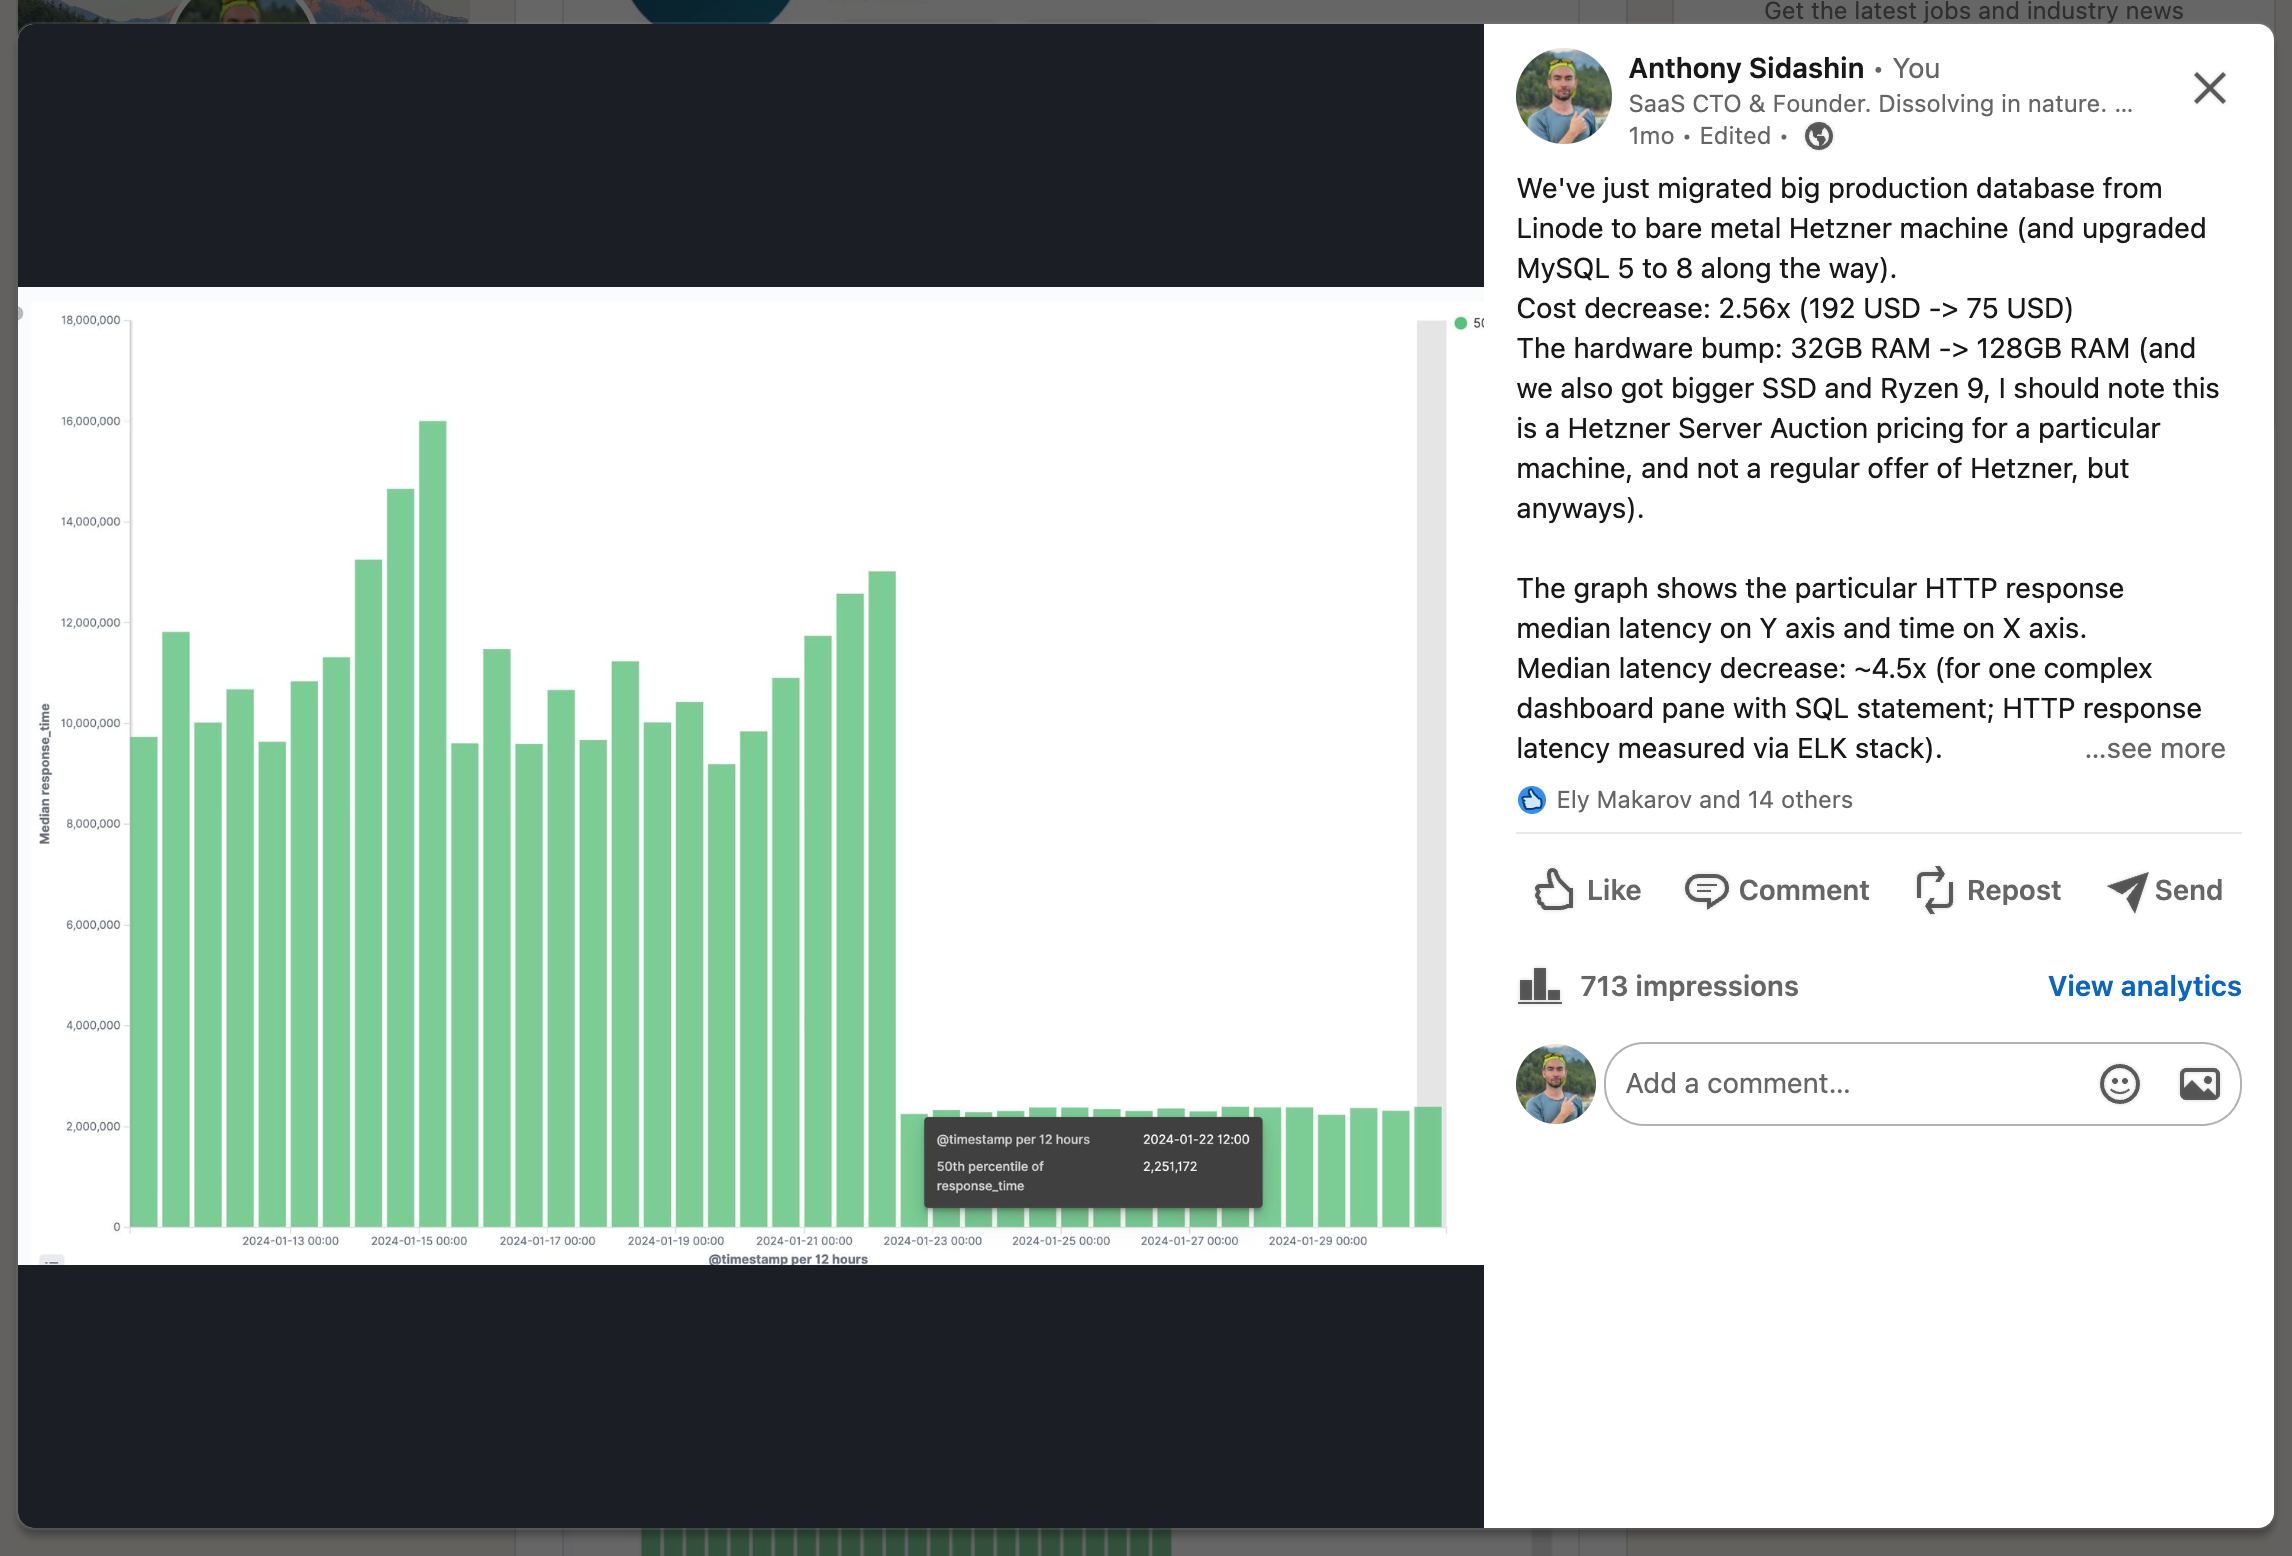
All logs from all servers and services flow to a machine with the ELK stack (Elasticsearch, Logstash, Kibana) - it happily eats hundreds of gigabytes of RAM, but for the last couple of years it hasn't crashed or caused any problems. (My recent Linkedin post regarding our primary database migration to Hetzner uses ELK visualisation)
Okay, I was not a huge fan of ElasticSearch 4 years ago when running it on our machines was cumbersome and expensive. Clickhouse seemed to be a very promising alternative for log storage tasks (and it indeed is!). But, ecosystem (Kibana!) is what makes ELK stack so great and strong - it just works with minimal effort. Now, when hardware and RAM got much more affordable for us, ELK stack is still rocking and I appreciate it a lot.
I think Grafana and recently Loki for log storage are a very competitive open source (open core?) players on the market which I still hope to try on some new project.
Metabase: SQL dashboard
For SQL reports, we use Metabase - a great open-source product with a great design that allows us to query databases and build reports based on them. (Don't forget to create a read-only user in your database and limit the export of users' personal data!)
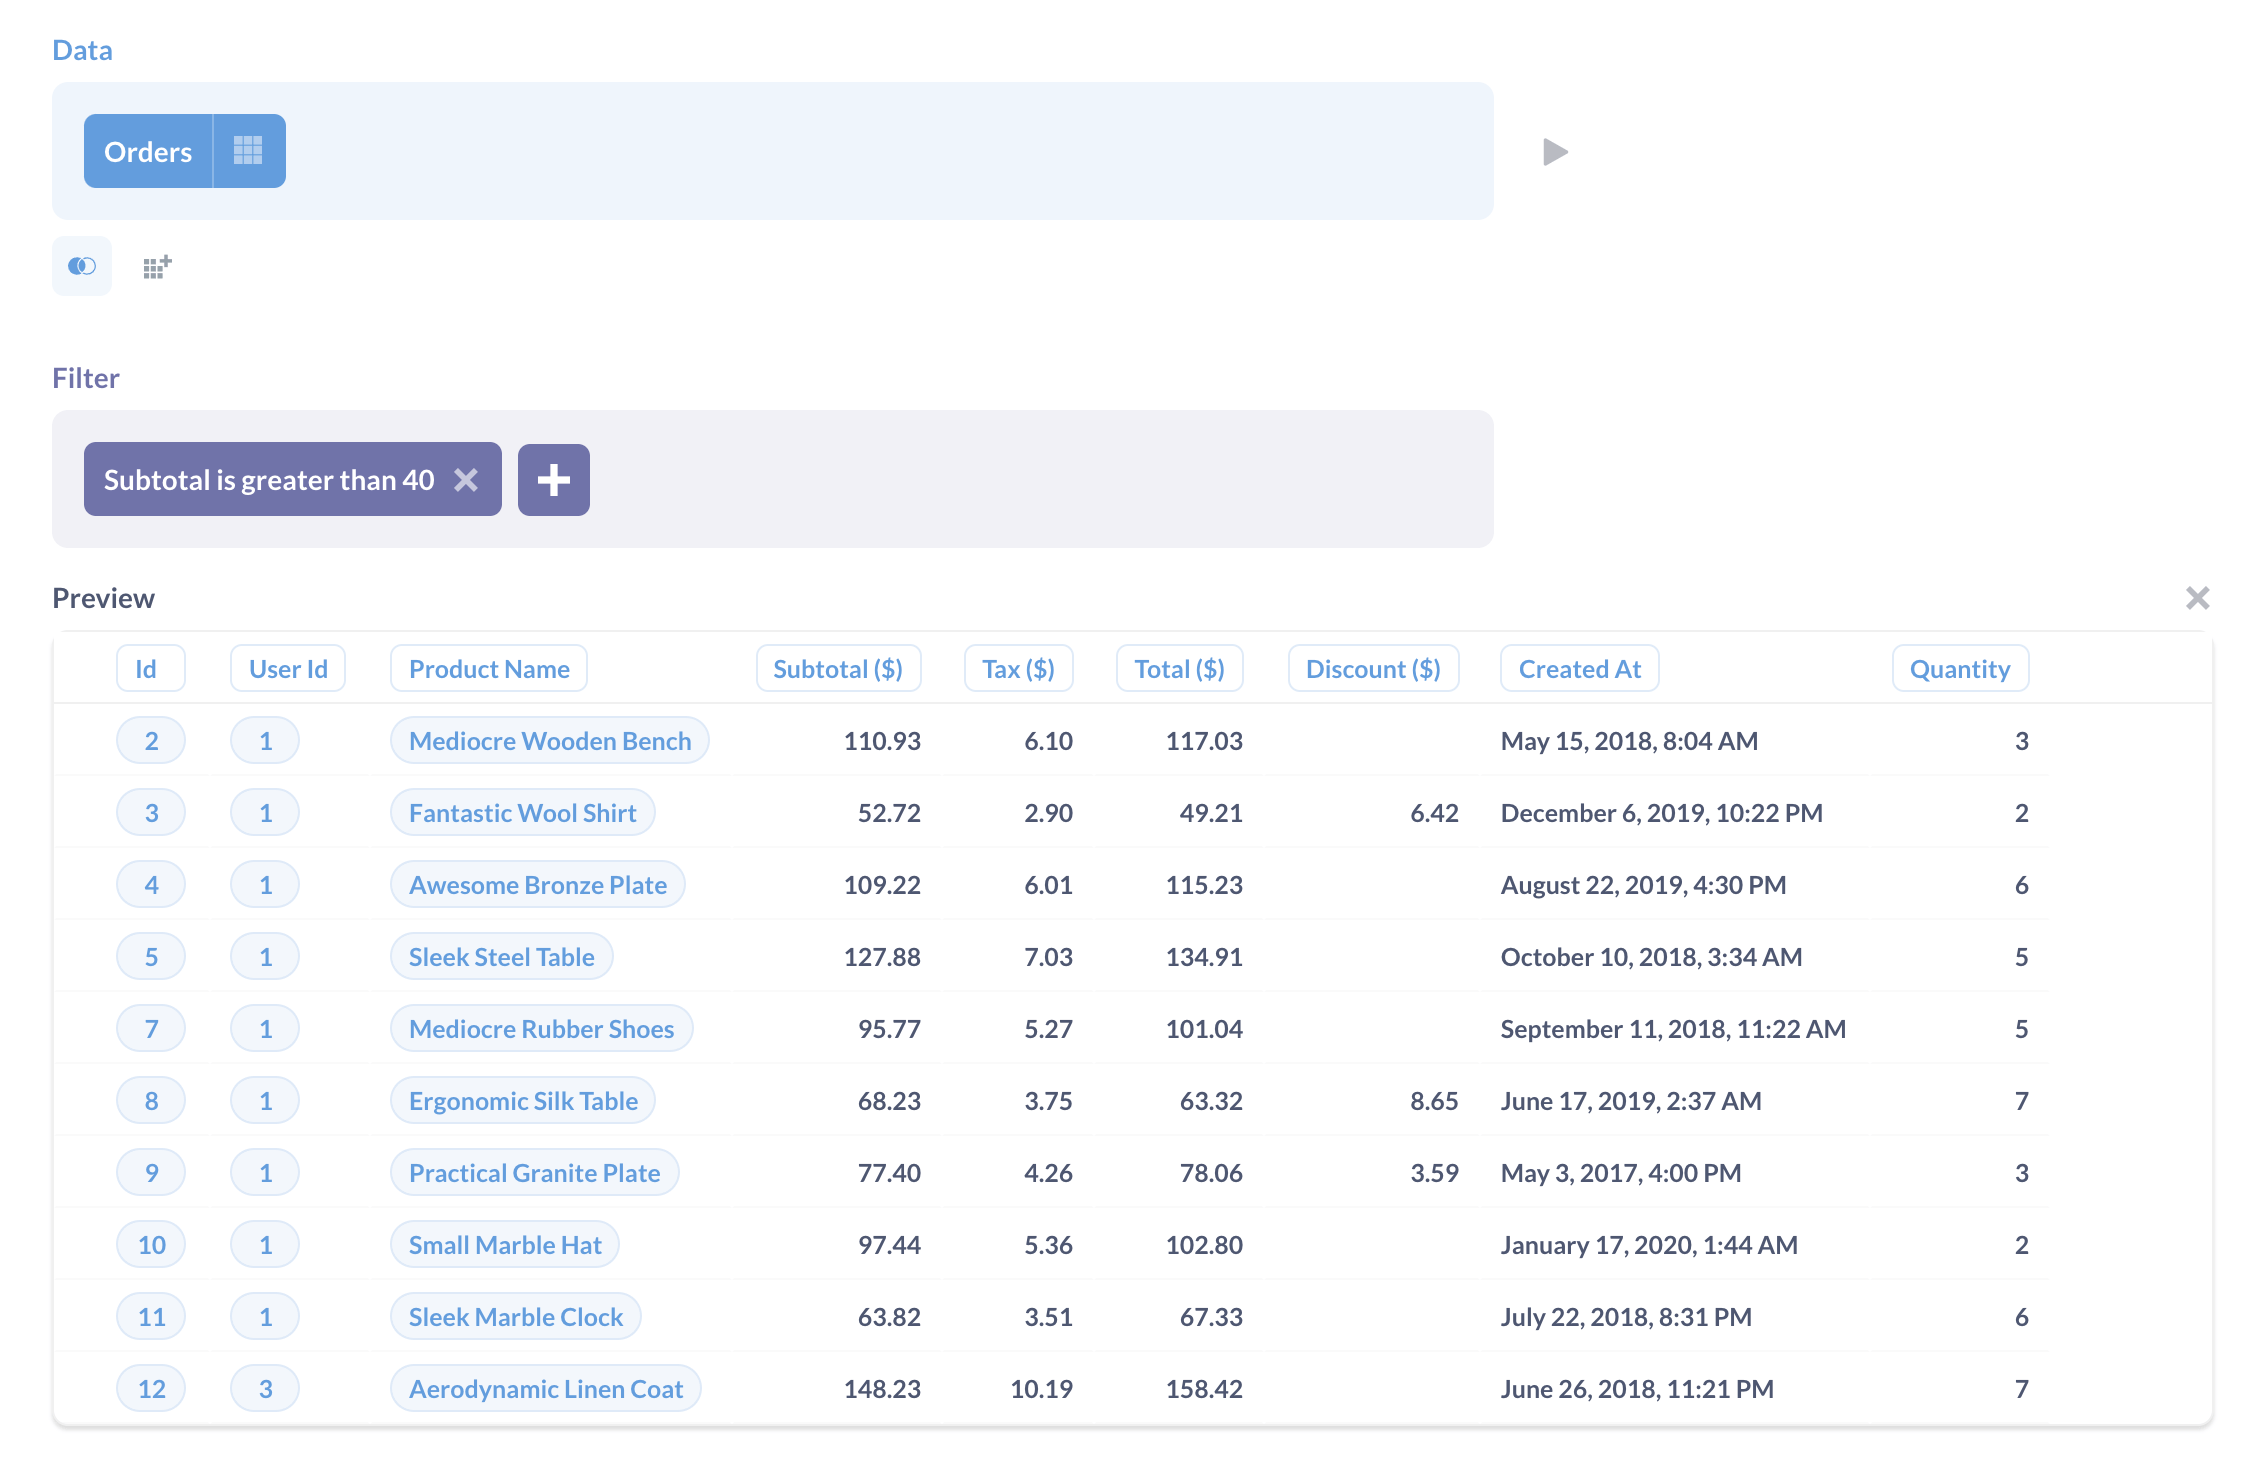
Metabase is so nice: not just for SRE needs; but also for financial department, for support department - we build a lot of dashboards and reports there and this saved us countless hours of development work (as before Metabase, all reports were implemented in our primary app PHP+MySQL backend).
Metabase killer feature for us is that allows to build SQL reports which are parametrized: you put certain [[symbols]] and these {{pieces}} become a convenient UI filters which can be used later by non-technical operators:
SELECT
  count(*)
FROM
  products
WHERE
  category = {{category}}
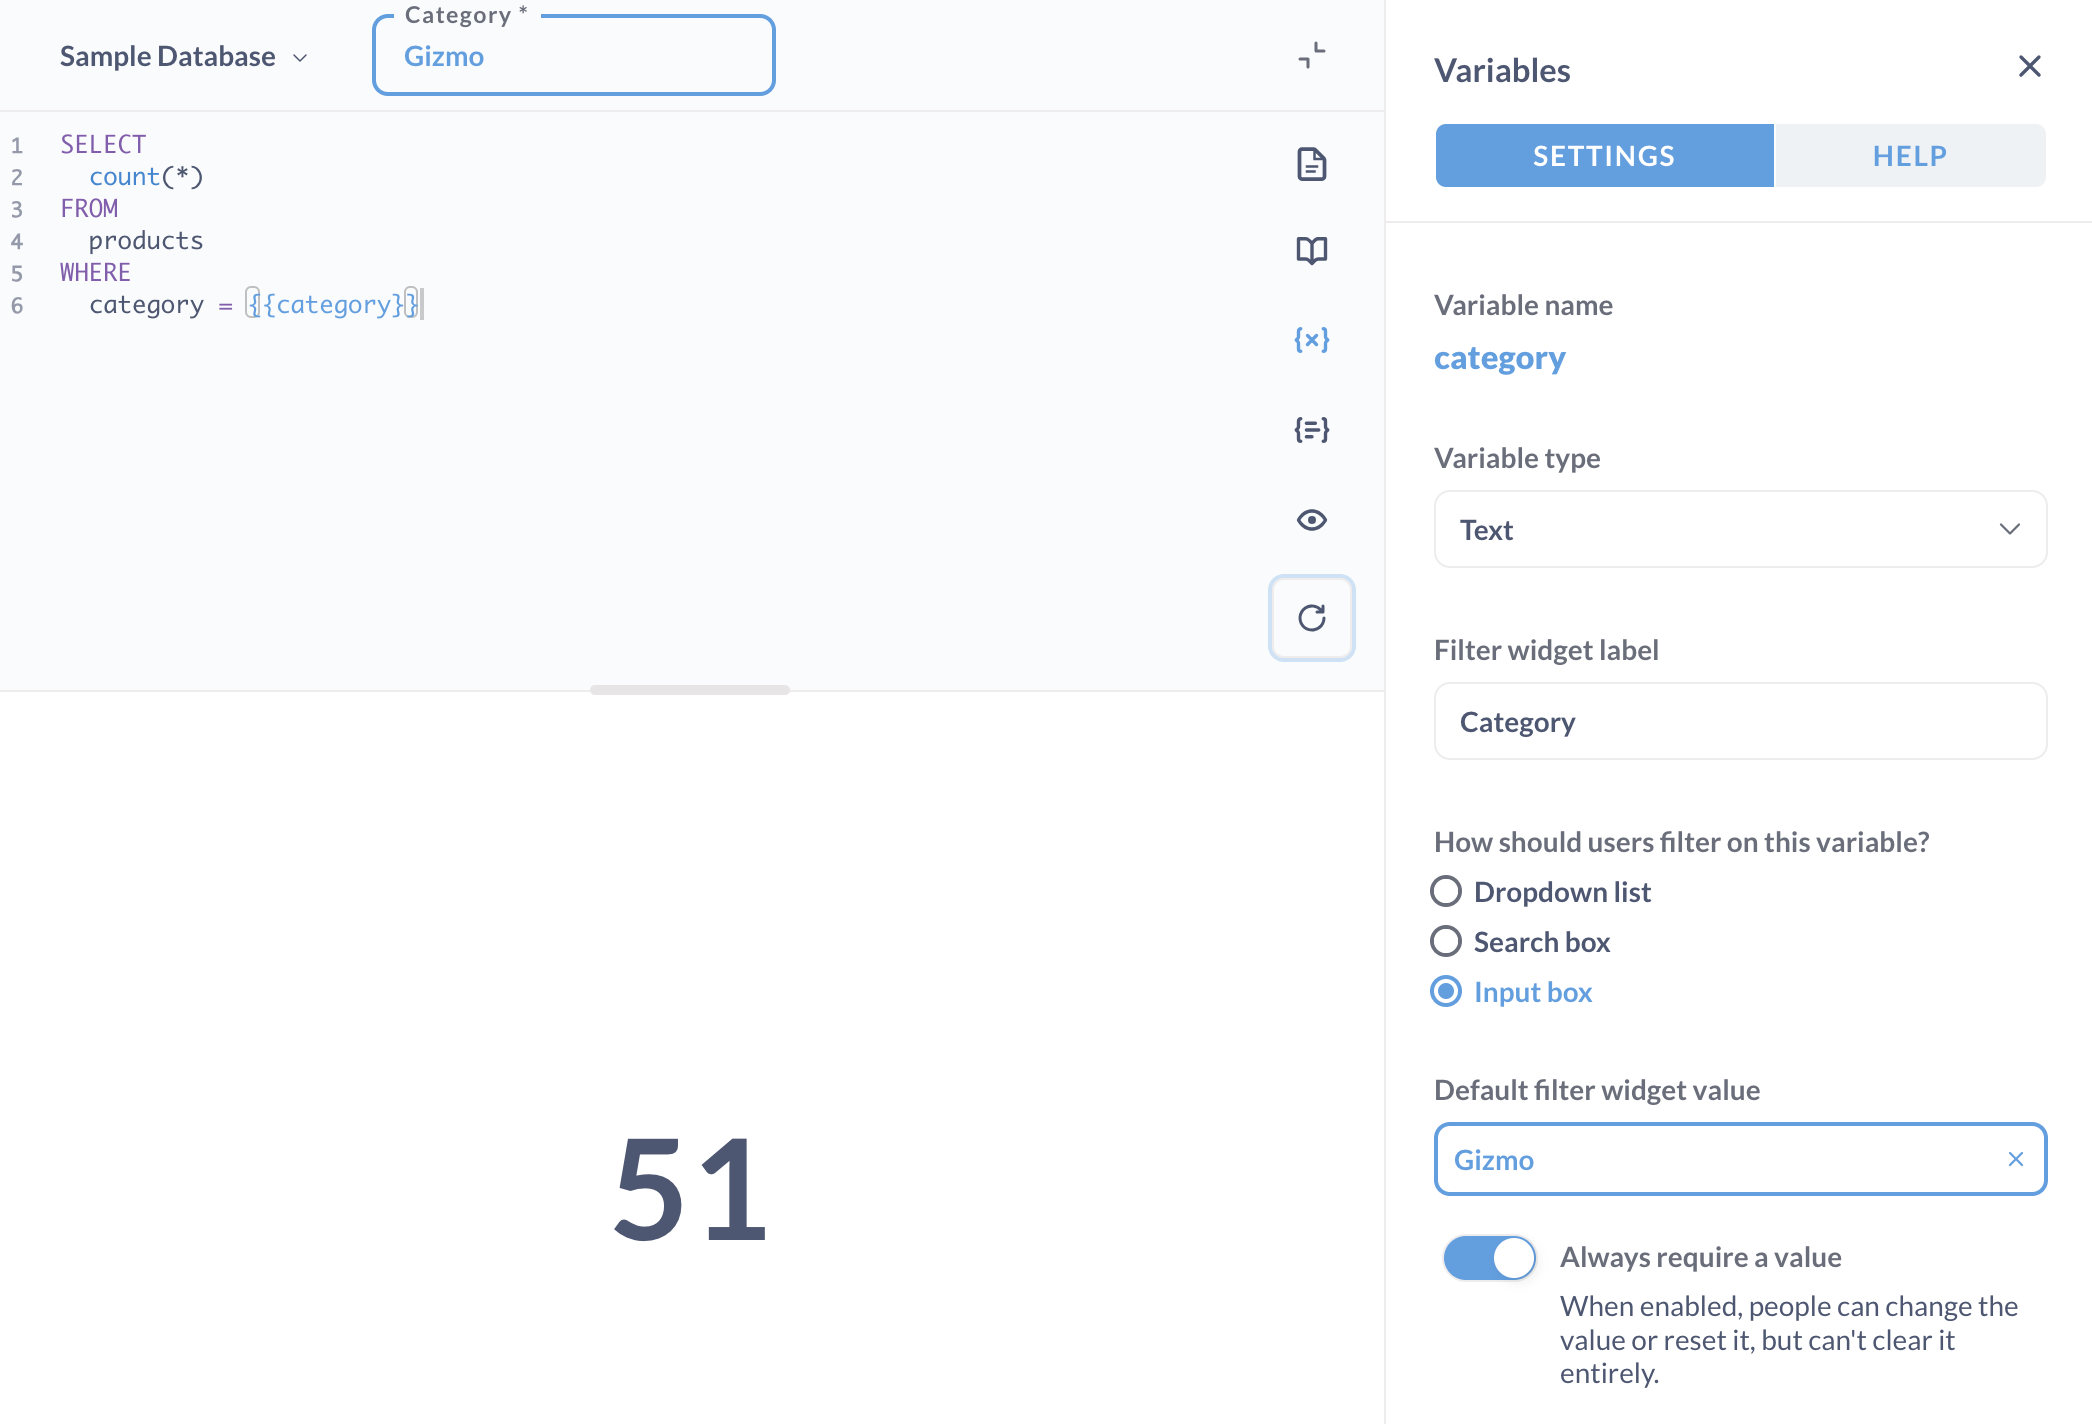
They also have visual GUI to replace SQL, but this is not what we use often: people who cannot write SQL usually just ask IT guys to create a new report for them.
I am pretty sure we will improve our report building workflow in 2024: with rapid LLM models evolution, I am pretty sure our finance department will soon be able to ask basic questions and GPT or Claude (200k tokens input is finally there!) will be able to spit out a usable SQL report for them.
Sentry: application error monitoring
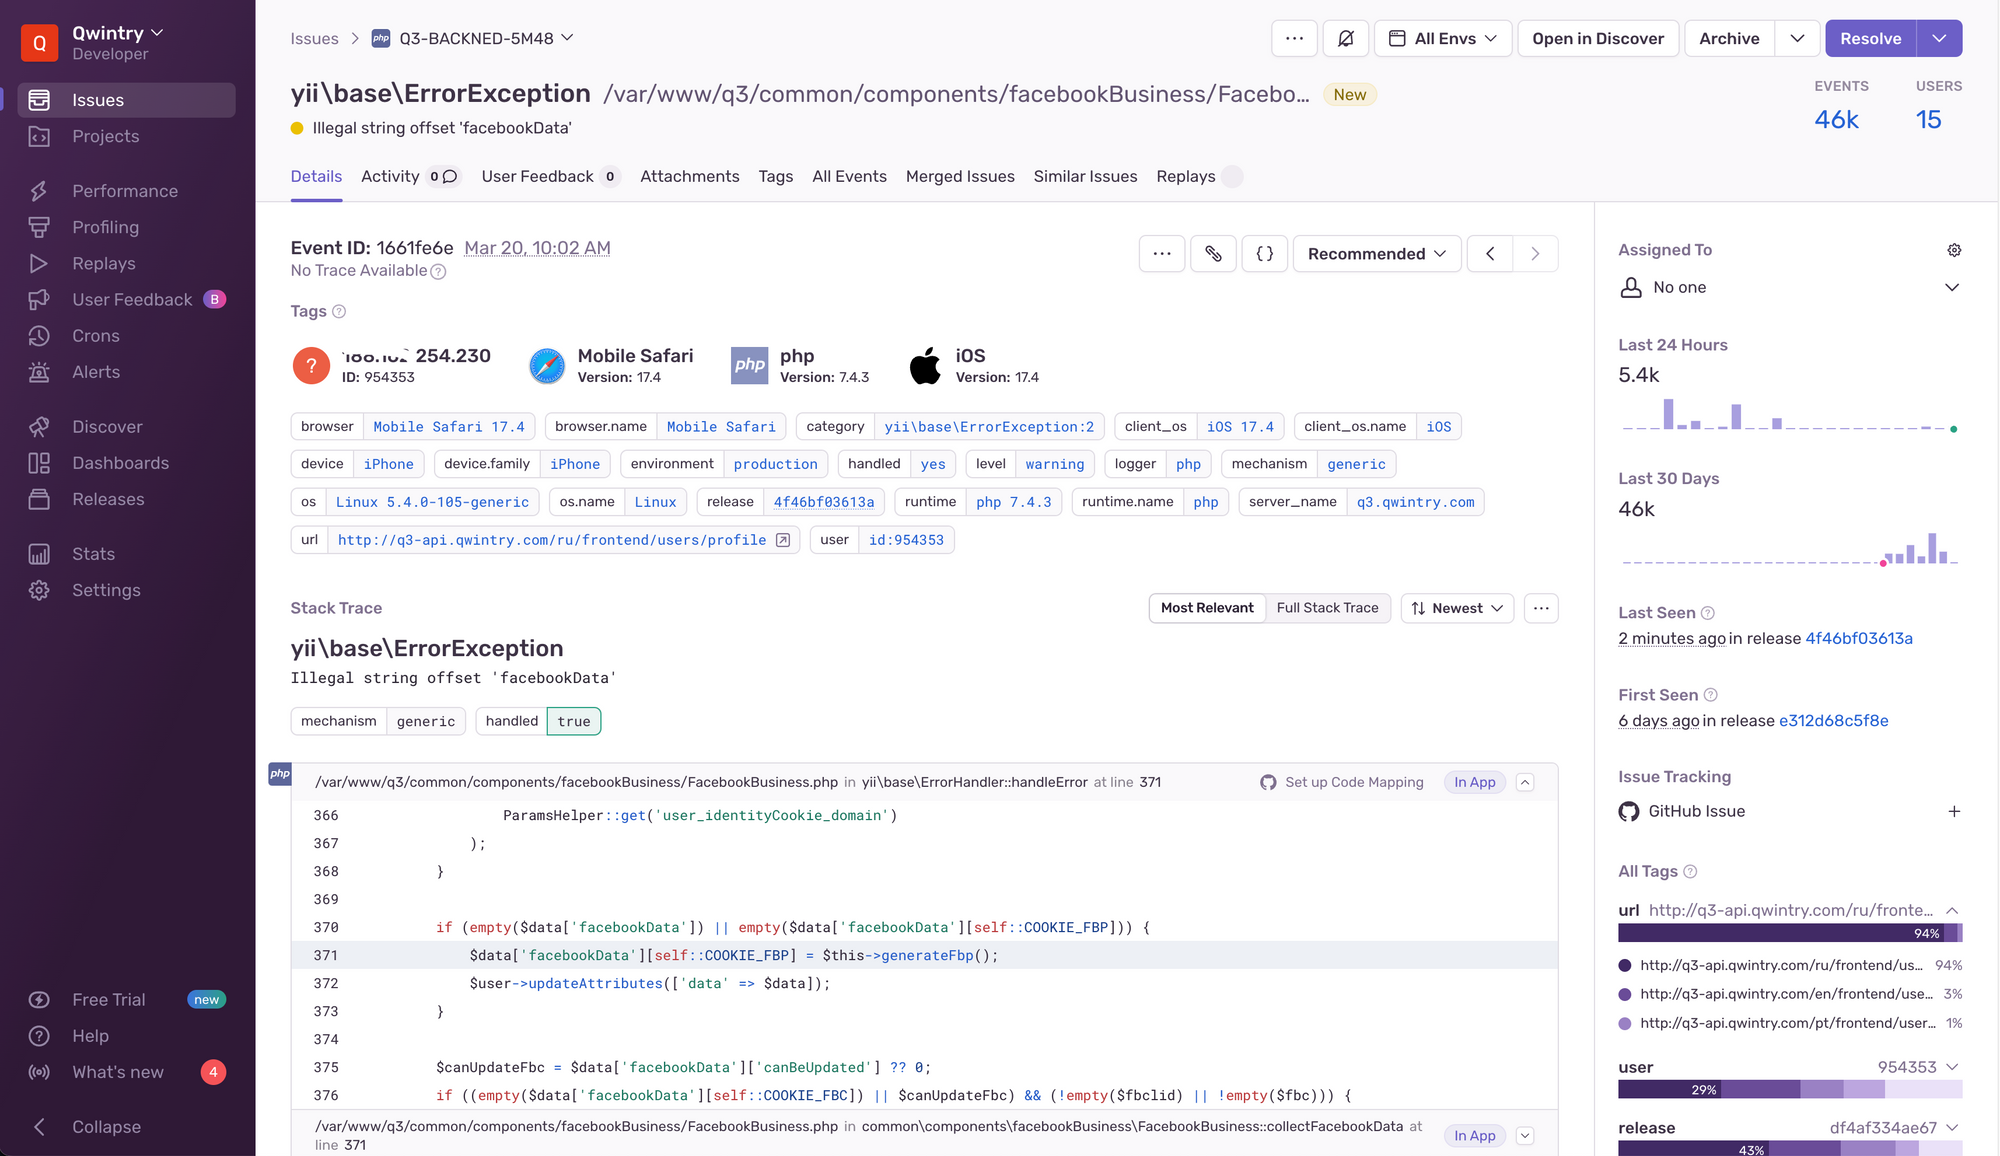
For monitoring code errors in production, we use Sentry.
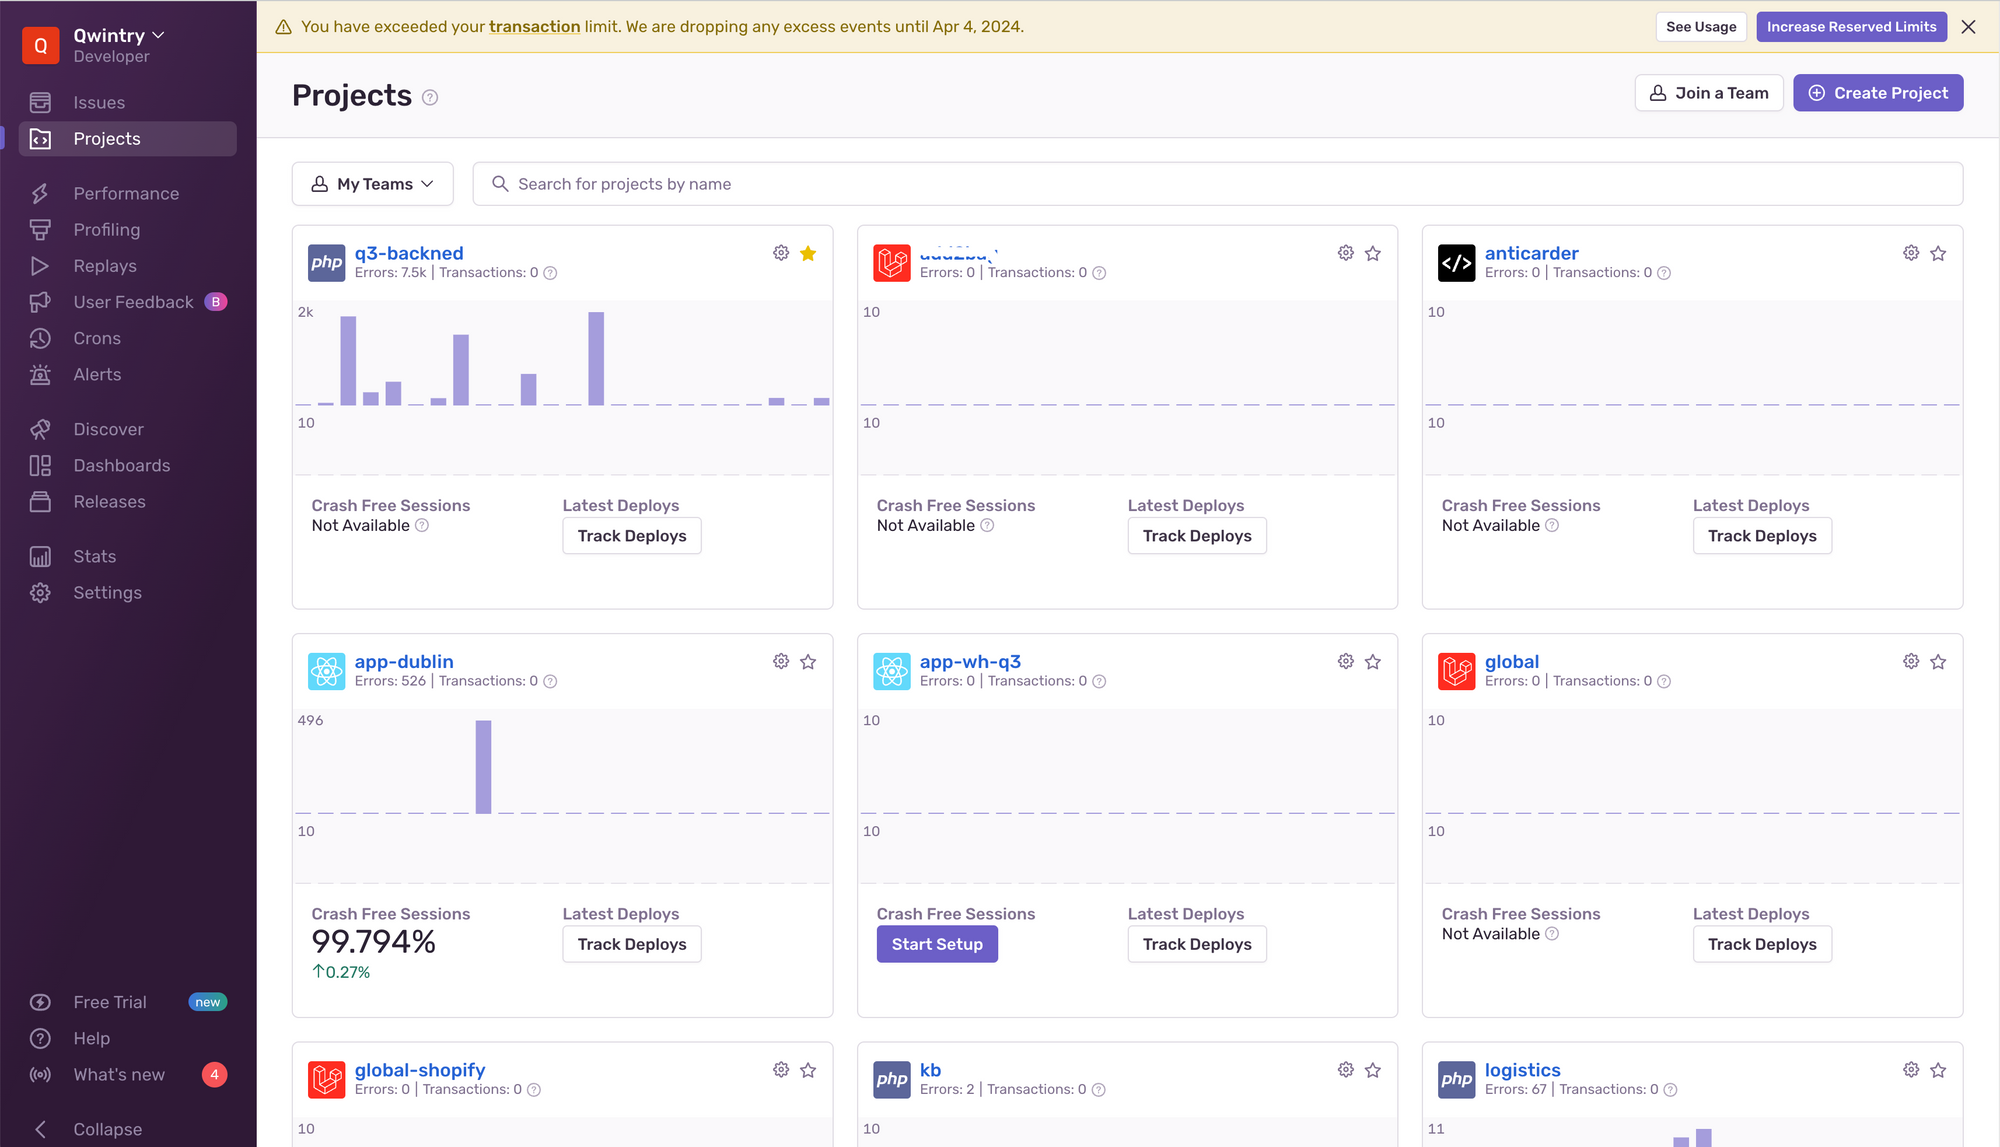
A few lines of code - and all our PHP, React-Native, Node.js apps are now reporting all error and exception stack traces into beautiful dashboard for easy investigations. It's awesome.
Choosing boring self-hosted products for SRE
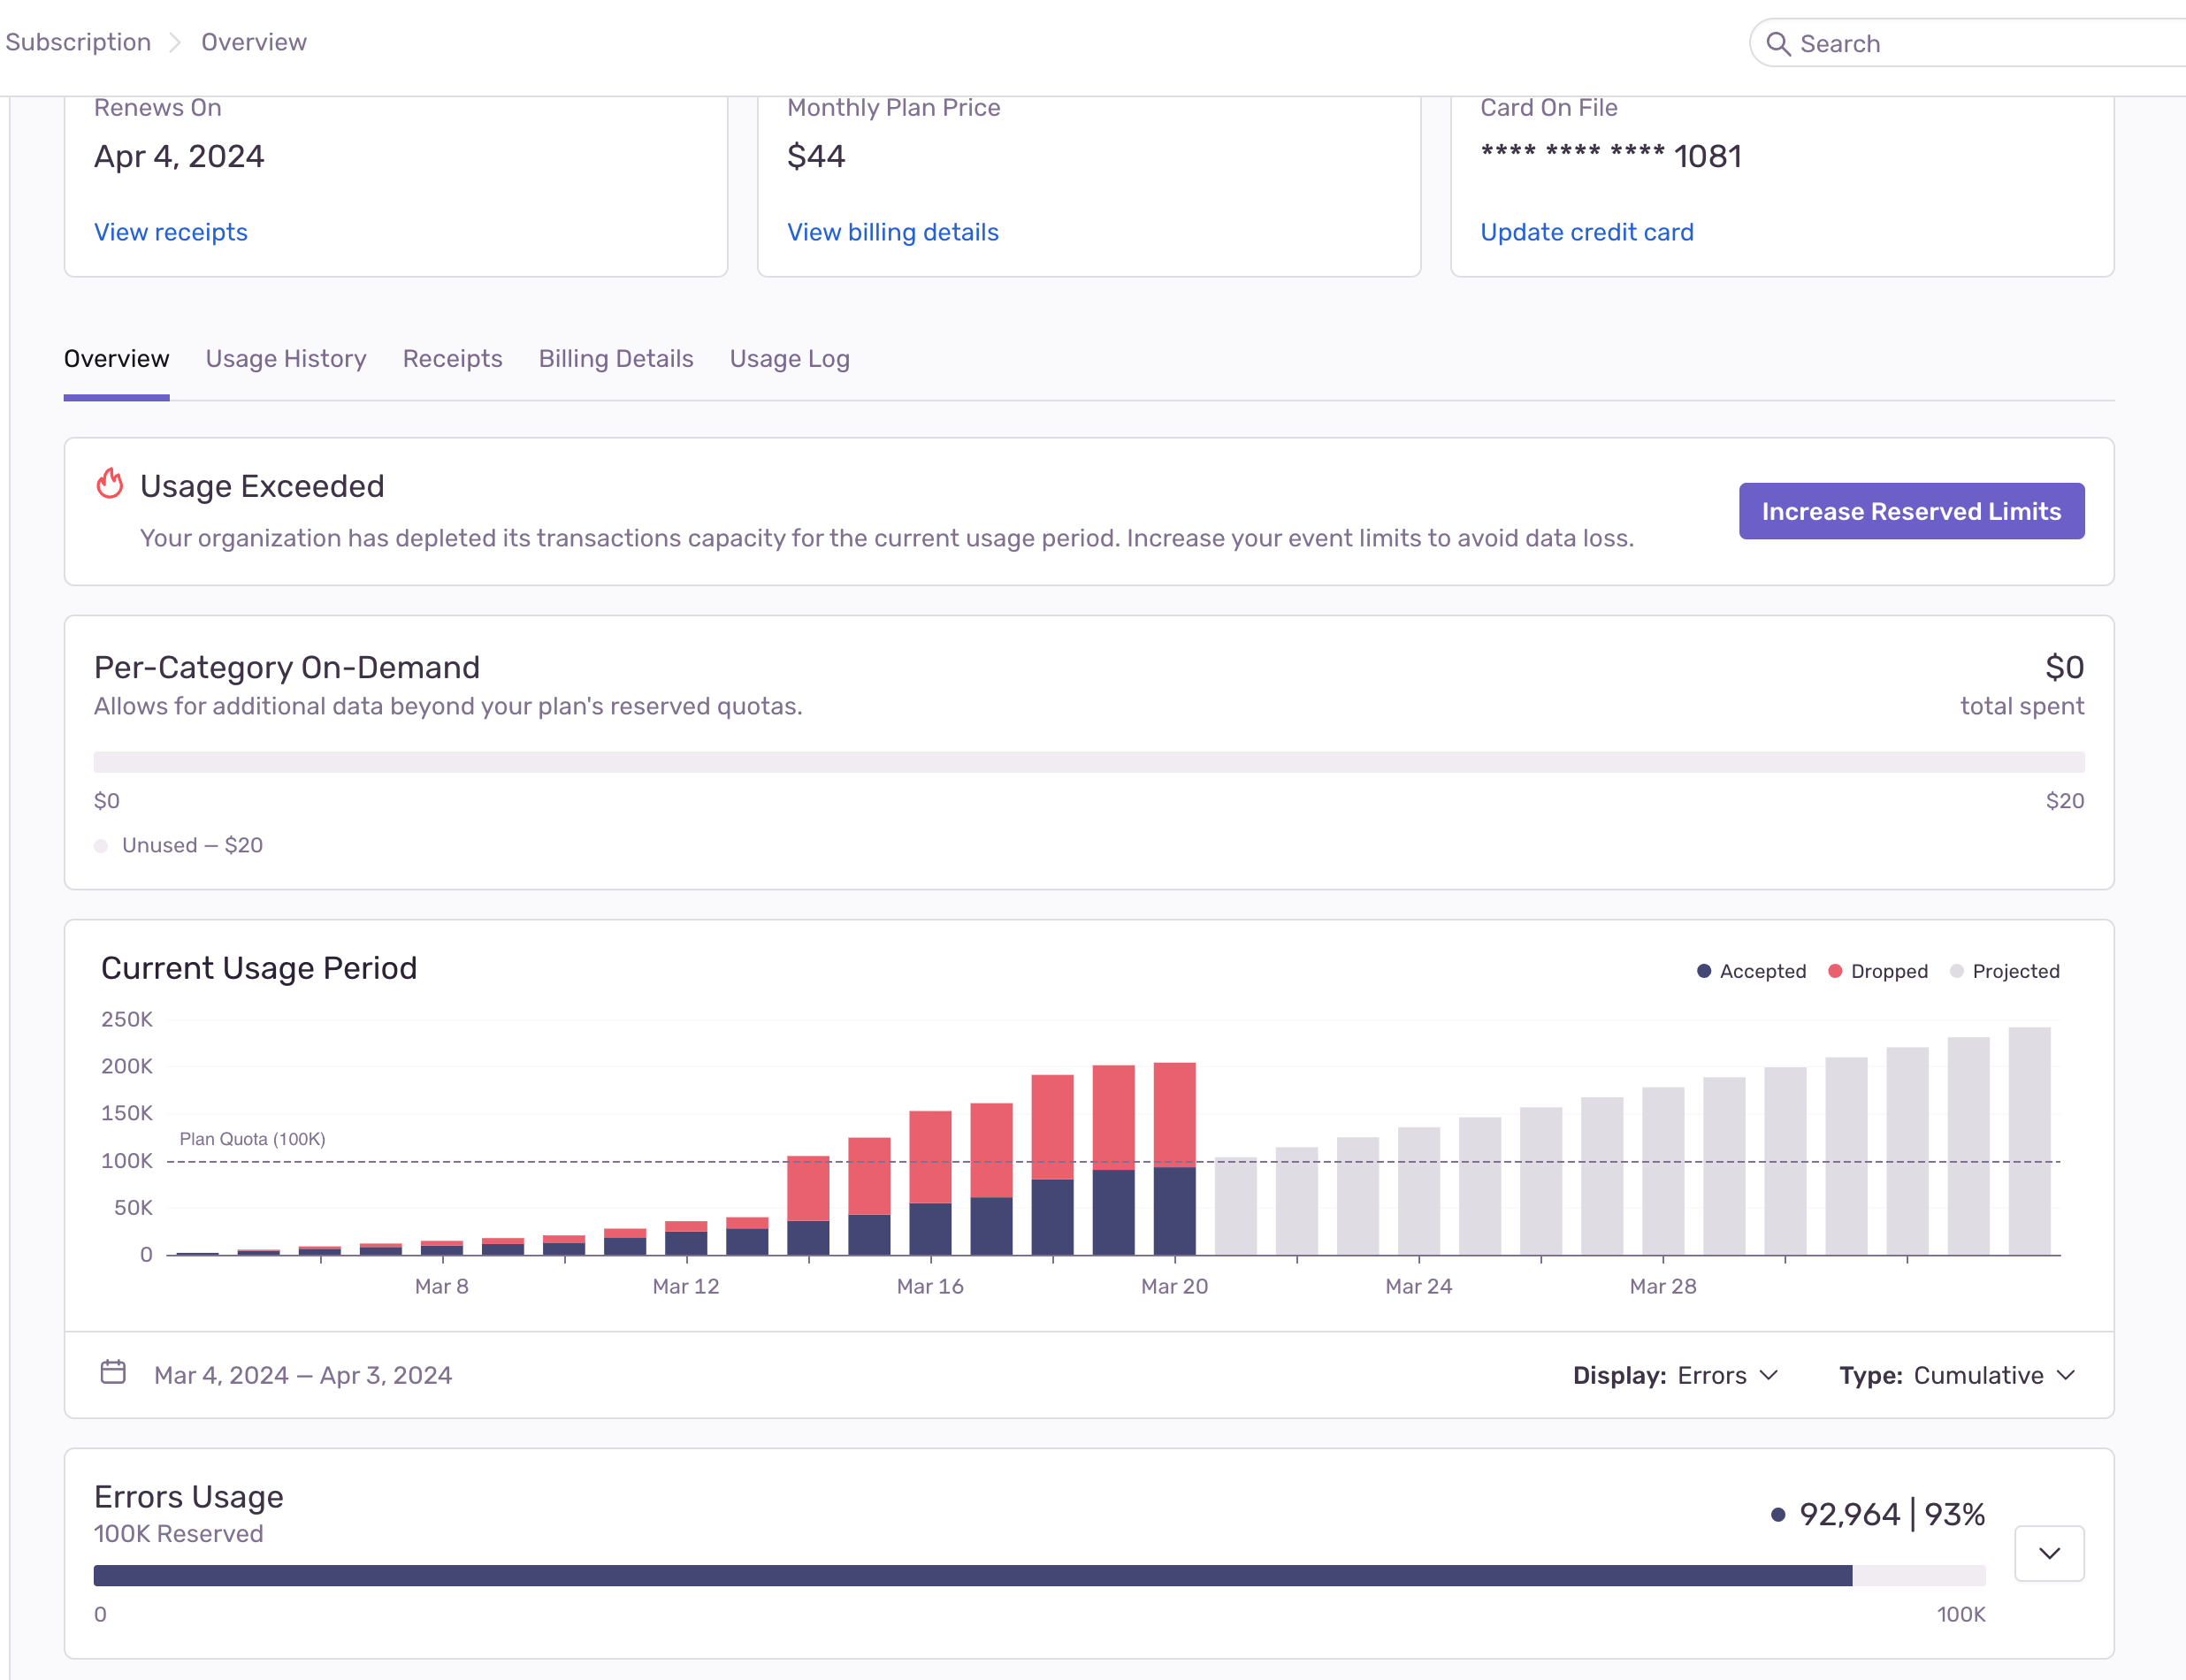
All of these products are self-hosted and open source. Except for the cloud version of Sentry, which has done an excellent job with its cloud solution in terms of cost control (constant spikes of hundreds of thousands of errors per hour don't affect our invoice too badly), and costs very little money relative to the benefit it provides.
All of these products are boring, in a good sense, not very innovative, work acceptably or well, and it's scary to think how many tens of thousands of dollars we would have shelled out if we had taken the "best on the market", as wealthier companies do.
For example, Datadog and NewRelic dominate the observability systems and log storage market, and they have excellent tools, but they're quite expensive - thousands of dollars per month. The scariest thing is not that it's expensive, but that it can very quickly get out of control when a random log file accidentally grows not by 1GB per day, but by 20GB per day. When you have dozens of machines and hundreds of services - ALWAYS some shit like that happens. We know this pretty well, because we recently paid 26K USD for an API which we even forgot we are using.